 Photo from Unsplash
Originally Posted On: https://medium.com/@umairg404/generate-pdf-with-itext7-in-minimal-net-core-8-a100c233cdd8
This article will teach us how to generate PDF with C# in .net core 8 minimal API. we will learn how to create barcodes, QRCode, Charts (OxyPlot, ScottPlot) and Tables. we need some libraries from the NuGet package manager.
OxyPlot chart here!
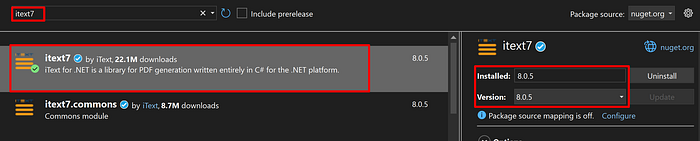
Choose your itext7 version here! or here!
Scott Plot charts here!
I am assuming you created the web API project. we need some packages like below
Install-Package itext7
Install-Package itext7.bouncy-castle-adapter
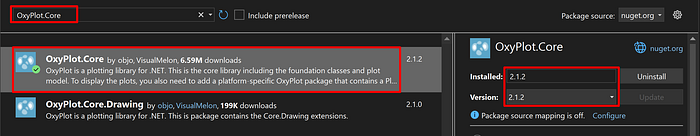
Install-Package OxyPlot.Core
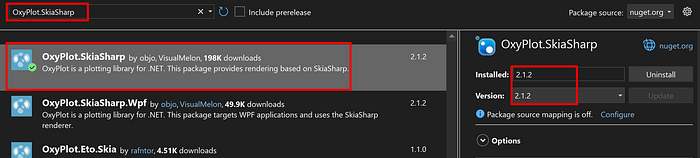
Install-Package OxyPlot.SkiaSharp
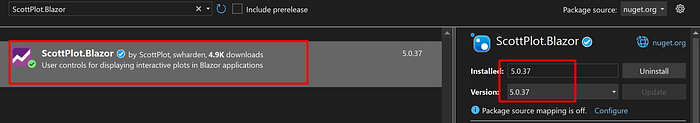
Install-Package ScottPlot.Blazor
Install-Package System.Drawing.Common
Alternatively, you can add it from the Nuget Package Manager UI tool.
Press enter or click to view image in full size
Press enter or click to view image in full size

For graphs I used OxyPlot.Core, OxyPlot.SkiaSharp, ScottPlot.Blazor
Press enter or click to view image in full size
Press enter or click to view image in full size
Press enter or click to view image in full size
Or double-click on the project name then Add the following PackageReference’s in the ItemGroup tag.
<ItemGroup>
  <PackageReference Include="itext7" Version="8.0.5" />
  <PackageReference Include="itext7.bouncy-castle-adapter" Version="8.0.5" />
  <PackageReference Include="Microsoft.AspNetCore.OpenApi" Version="8.0.5" />
  <PackageReference Include="OxyPlot.Core" Version="2.1.2" />
  <PackageReference Include="OxyPlot.SkiaSharp" Version="2.1.2" />
  <PackageReference Include="ScottPlot.Blazor" Version="5.0.37" />
  <PackageReference Include="Swashbuckle.AspNetCore" Version="6.4.0" />
  <PackageReference Include="System.Drawing.Common" Version="8.0.8" />
</ItemGroup>
Before we dive into building PDFs programmatically with iText7, let me mention an alternative that might save you some time, especially if you’re already comfortable with HTML/CSS.
IronPDF takes a different approach — instead of manually creating tables, positioning elements, and handling page breaks in code, you can design your PDF using HTML and CSS, then convert it to PDF. Here’s what caught my attention:
Those complex tables we’re about to build? Just use HTML <table> tags with CSS styling
Headers and footers that automatically repeat? Simple CSS with @page rules
Charts from OxyPlot or ScottPlot? You could use JavaScript charting libraries like Chart.js and render them directly
All that margin calculation and positioning code? Let CSS handle it with familiar properties
IronPDF isn’t just for .NET either — they’ve expanded to Java, Python, and Node.js. So if you’re working across different stacks, you might find it useful.
And here’s where it gets interesting — if you need barcodes and QR codes like we’re implementing below, IronBarcode (part of the Iron Suite) generates them with just a line or two of code. No need for the manual barcode setup we’re about to do. Though I’ll admit, there’s something satisfying about understanding how it all works under the hood with iText7.
That said, iText7 gives you pixel-perfect control over every element, which is exactly what some projects need. Let’s continue with the iText7 approach — it’s a great way to understand PDF generation at a fundamental level.
Now add a new class WeatherData.cs to the project.
public class WeatherData
{
    public DateTime Date { get; set; }
    public int Temperature { get; set; }
    public string Summary { get; set; }
public WeatherData(DateTime date, int temperature, string summary)
{
Date = date;
Temperature = temperature;
Summary = summary;
}
}
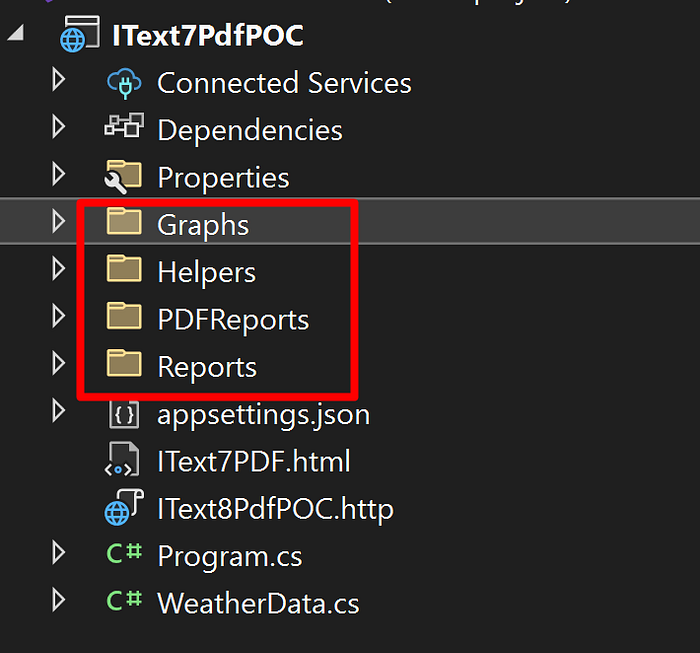
Now Add the following folders to the project. Graphs, Helpers, PDFReports, Reports I added folders with these provided names for my eas you can name it as you wish.
Press enter or click to view image in full size
Right Click on the folder Helpers & add the following classes
using iText.IO.Image;
using iText.Layout.Element;
namespace IText7PdfPOC.Helpers
{
public static class ConvertToITextImageClass
{
public static Image ConvertToITextImage(System.Drawing.Image drawingImage)
{
// Convert System.Drawing.Image to a byte array
using (var ms = new MemoryStream())
{
drawingImage.Save(ms, drawingImage.RawFormat);
byte[] imageBytes = ms.ToArray();
// Create iText ImageData object from the byte array
var imageData = ImageDataFactory.Create(imageBytes);
// Create iText Image element
return new iText.Layout.Element.Image(imageData);
}
}
public static iText.Layout.Element.Image ConvertBytesToITextImage(byte[] imageBytes)
{
// Create iText ImageData object from the byte array
var imageData = ImageDataFactory.Create(imageBytes);
// Create iText Image element
return new iText.Layout.Element.Image(imageData);
}
}
}
using iText.Barcodes;
using iText.Kernel.Colors;
using iText.Kernel.Pdf;
using iText.Kernel.Pdf.Xobject;
using iText.Layout.Element;
namespace IText7PdfPOC.Helpers
{
public static class GenerateBarCode
{
public static Image GetBarcodeImage(string text,Color BarCodcolor,Color BarcodTextColor,PdfDocument document)
{
//Create a barcode object
Barcode128 barcode = new Barcode128(document);
//Set the code to be encoded
barcode.SetCode(text);
//Set the code type
barcode.SetCodeType(Barcode128.CODE128);
//Set the height of the barcode
barcode.SetBarHeight(20);
//PDF from XObject
PdfFormXObject barcodeObject= barcode.CreateFormXObject(BarCodcolor, BarcodTextColor,document);
//Create an image object
var barcodeImage = new Image(barcodeObject);
return barcodeImage;
}
}
}
using iText.Barcodes;
using iText.Kernel.Colors;
using iText.Kernel.Pdf;
using iText.Layout.Element;
namespace IText7PdfPOC.Helpers
{
public static class GenerateQRCode
{
public static Image GetQRCodeImage(string text,Color qrColor, PdfDocument document)
{
//Create a barcode object
var qrCode = new BarcodeQRCode();
qrCode.SetCode(text);
var qrCodeObject = qrCode.CreateFormXObject(qrColor, document);
return new Image(qrCodeObject);
}
}
}
Now right-click on the folder Graphs and add the following classes.
What will I do with graphs I will generate a graph save it as an image and add it to my itext7 PDF.
using iText.IO.Image;
using OxyPlot;
using OxyPlot.Series;
using OxyPlot.SkiaSharp;
using System.Drawing;
namespace IText7PdfPOC.Graphs
{
public static class OxyPlotGraphs
{
public static iText.Layout.Element.Image GenerateOxyPlotLineChart()
{
// Generate chart as an image
var plotModel = new PlotModel { Title = “Line Chart Example” };
plotModel.Series.Add(new LineSeries
{
Title = “Series 1”,
Points = { new DataPoint(0, 0), new DataPoint(10, 18), new DataPoint(20, 12) },
});
// Use OxyPlot to render the chart to a stream
using (var chartStream = new MemoryStream())
{
var pngExporter = new PngExporter { Width = 600, Height = 400 };
pngExporter.Export(plotModel, chartStream);
chartStream.Position = 0; // Reset the stream position
// Convert chart stream to an iText7 image
var chartImage = new iText.Layout.Element.Image(ImageDataFactory.Create(chartStream.ToArray()));
return chartImage;
}
}
public static iText.Layout.Element.Image GenerateOxyPlotAreaChart()
{
int width = 600;
int height = 400;
Random rng = new Random();
using (Bitmap bitmap = new Bitmap(width, height))
{
using (Graphics graphics = Graphics.FromImage(bitmap))
{
// Clear the background
graphics.Clear(System.Drawing.Color.White);
// Set up pens, brushes, and fonts
Pen pen = new Pen(System.Drawing.Color.Black, 2);
Brush brush = Brushes.LightBlue; // Brush for the area fill
Font font = new Font(“Arial”, 10);
Brush textBrush = Brushes.Black;
// Draw axes
graphics.DrawLine(pen, 50, 350, 550, 350); // X-Axis
graphics.DrawLine(pen, 50, 350, 50, 50); // Y-Axis
// Data points
PointF[] points = new PointF[]
{
new PointF(50, 300),
new PointF(150, 250),
new PointF(250, 200),
new PointF(350, 150),
new PointF(450, 400),
new PointF(550, 50)
};
// Create an array for the area fill points, including the baseline
PointF[] areaPoints = new PointF[points.Length + 2];
areaPoints[0] = new PointF(points[0].X, 350); // Start at the X-axis
areaPoints[areaPoints.Length – 1] = new PointF(points[points.Length – 1].X, 350); // End at the X-axis
// Copy the original points into the areaPoints array
Array.Copy(points, 0, areaPoints, 1, points.Length);
// Fill the area
graphics.FillPolygon(brush, areaPoints);
// Draw the line over the filled area
graphics.DrawLines(pen, points);
// Draw labels for each point
for (int i = 0; i < points.Length; i++)
{
string label = $”P{i + 1}“;
graphics.DrawString(label, font, textBrush, points[i].X – 10, points[i].Y – 20);
}
}
// Convert the Bitmap to a byte array
using (MemoryStream chartStream = new MemoryStream())
{
bitmap.Save(chartStream, System.Drawing.Imaging.ImageFormat.Png);
byte[] imageBytes = chartStream.ToArray();
// Create iText7 ImageData and Image from the byte array
ImageData imageData = ImageDataFactory.Create(imageBytes);
return new iText.Layout.Element.Image(imageData).SetAutoScale(true);
}
}
}
public static iText.Layout.Element.Image GenerateOxyPlotWeatherAreaChart(List<WeatherData> weatherData)
{
int width = 600;
int height = 400;
using (Bitmap bitmap = new Bitmap(width, height))
{
using (Graphics graphics = Graphics.FromImage(bitmap))
{
// Clear the background
graphics.Clear(System.Drawing.Color.White);
// Set up pens, brushes, and fonts
Pen pen = new Pen(System.Drawing.Color.Black, 2);
Brush areaBrush = Brushes.LightBlue; // Brush for the area fill
Font font = new Font(“Arial”, 10);
Brush textBrush = Brushes.Black;
// Draw axes
graphics.DrawLine(pen, 50, 350, 550, 350); // X-Axis
graphics.DrawLine(pen, 50, 350, 50, 50); // Y-Axis
// Prepare points for the area chart
PointF[] points = new PointF[weatherData.Count];
PointF[] areaPoints = new PointF[weatherData.Count + 2];
areaPoints[0] = new PointF(50, 350); // Start at the X-axis
areaPoints[areaPoints.Length – 1] = new PointF(550, 350); // End at the X-axis
float xStep = 500f / (weatherData.Count – 1);
for (int i = 0; i < weatherData.Count; i++)
{
float x = 50 + i * xStep;
float y = 350 – (weatherData[i].Temperature * 3); // Scale temperature
points[i] = new PointF(x, y);
areaPoints[i + 1] = points[i];
// Draw labels for each point
//{weatherData[i].Date.ToShortDateString()}:
string label = $”{weatherData[i].Temperature}°Cn{weatherData[i].Summary}“;
graphics.DrawString(label, font, textBrush, x – 30, y – 40);
}
// Fill the area under the line
graphics.FillPolygon(areaBrush, areaPoints);
// Draw the line over the filled area
graphics.DrawLines(pen, points);
}
// Convert the Bitmap to a byte array
using (MemoryStream chartStream = new MemoryStream())
{
bitmap.Save(chartStream, System.Drawing.Imaging.ImageFormat.Png);
chartStream.Position = 0;
// Create iText7 ImageData and Image from the byte array
ImageData imageData = ImageDataFactory.Create(chartStream.ToArray());
return new iText.Layout.Element.Image(imageData).SetAutoScale(true);
}
}
}
public static iText.Layout.Element.Image GenerateOxyPlotPieChart()
{
var plotModel = new PlotModel { Title = “Sample Pie Chart” };
var pieSeries = new PieSeries
{
StrokeThickness = 2.0,
InsideLabelPosition = 0.8,
AngleSpan = 360,
StartAngle = 0,
TextColor = OxyColors.Black,
InsideLabelColor = OxyColors.White,
OutsideLabelFormat = “{0}: {1}”
};
Random rnd = new Random();
var listOfColors = new List<OxyColor> { };
pieSeries.Slices.Add(new PieSlice(“Category A”, 40) { IsExploded = true, Fill = OxyColors.Red });
pieSeries.Slices.Add(new PieSlice(“Category B”, 30) { Fill = OxyColors.Blue });
pieSeries.Slices.Add(new PieSlice(“Category C”, 20) { Fill = OxyColors.Green });
pieSeries.Slices.Add(new PieSlice(“Category D”, 10) { Fill = OxyColors.Yellow });
plotModel.Series.Add(pieSeries);
// Render the plot to a bitmap image
var pngExporter = new PngExporter { Width = 600, Height = 400 };
using (var stream = new MemoryStream())
{
pngExporter.Export(plotModel, stream);
// Convert the bitmap stream to an iTextSharp Image
var itextImage = new iText.Layout.Element.Image(ImageDataFactory.Create(stream.ToArray()));
return itextImage;
}
}
}
}
using IText7PdfPOC.Helpers;
using ScottPlot;
namespace IText7PdfPOC.Graphs
{
public static class scottplotGraphs
{
public static iText.Layout.Element.Image GenerateScottPlotBars()
{
Plot myPlot = new();
double[] xs1 = { 1, 2, 3, 4 };
double[] ys1 = { 5, 10, 7, 13 };
var bars1 = myPlot.Add.Bars(xs1, ys1);
bars1.LegendText = “Alpha”;
double[] xs2 = { 6, 7, 8, 9 };
double[] ys2 = { 7, 12, 9, 15 };
var bars2 = myPlot.Add.Bars(xs2, ys2);
bars2.LegendText = “Beta”;
myPlot.ShowLegend(Alignment.UpperLeft);
myPlot.Axes.Margins(bottom: 0);
myPlot.SavePng(“demo.png”, 400, 300);
byte[] imageBytes = myPlot.GetImageBytes(400, 300, ScottPlot.ImageFormat.Png);
using (MemoryStream imageStream = new MemoryStream(imageBytes))
{
return ConvertToITextImageClass.ConvertBytesToITextImage(imageBytes);
}
}
public static iText.Layout.Element.Image GenerateScottPlotBox()
{
Plot myplot = new Plot();
ScottPlot.Box box = new()
{
Position = 5,
BoxMin = 81,
BoxMax = 99,
WhiskerMin = 75,
WhiskerMax = 105,
BoxMiddle = 90,
};
myplot.Add.Box(box);
myplot.Axes.SetLimits(0, 10, 70, 110);
myplot.SavePng(“boxplot.png”, 400, 300);
byte[] imageBytes = myplot.GetImageBytes(400, 300, ScottPlot.ImageFormat.Png);
using (MemoryStream imageStream = new MemoryStream(imageBytes))
{
return ConvertToITextImageClass.ConvertBytesToITextImage(imageBytes);
}
}
public static iText.Layout.Element.Image GenerateScottPlotGroupBox()
{
ScottPlot.Plot myPlot = new();
List<ScottPlot.Box> boxes1 = new() {
Generate.RandomBox(1),
Generate.RandomBox(2),
Generate.RandomBox(3),
};
List<ScottPlot.Box> boxes2 = new() {
Generate.RandomBox(5),
Generate.RandomBox(6),
Generate.RandomBox(7),
};
var bp1 = myPlot.Add.Boxes(boxes1);
bp1.LegendText = “Group 1”;
var bp2 = myPlot.Add.Boxes(boxes2);
bp2.LegendText = “Group 2”;
myPlot.ShowLegend(Alignment.UpperRight);
myPlot.SavePng(“demo.png”, 400, 300);
byte[] imageBytes = myPlot.GetImageBytes(400, 300, ScottPlot.ImageFormat.Png);
using (MemoryStream imageStream = new MemoryStream(imageBytes))
{
return ConvertToITextImageClass.ConvertBytesToITextImage(imageBytes);
}
}
public static iText.Layout.Element.Image GenerateScottPlotPieSliceLabels()
{
ScottPlot.Plot myPlot = new();
PieSlice slice1 = new() { Value = 5, FillColor = Colors.Red, Label = “Red” };
PieSlice slice2 = new() { Value = 2, FillColor = Colors.Orange, Label = “Orange” };
PieSlice slice3 = new() { Value = 8, FillColor = Colors.Gold, Label = “Yellow” };
PieSlice slice4 = new() { Value = 4, FillColor = Colors.Green, Label = “Green” };
PieSlice slice5 = new() { Value = 8, FillColor = Colors.Blue, Label = “Blue” };
List<PieSlice> slices = new() { slice1, slice2, slice3, slice4, slice5 };
// setup the pie to display slice labels
var pie = myPlot.Add.Pie(slices);
pie.ExplodeFraction = .1;
pie.ShowSliceLabels = true;
pie.SliceLabelDistance = 1.3;
// styling can be customized for individual slices
slice5.LabelStyle.FontSize = 22;
slice5.LabelStyle.ForeColor = Colors.Magenta;
slice5.LabelStyle.Bold = true;
myPlot.SavePng(“demopie.png”, 600, 400);
byte[] imageBytes = myPlot.GetImageBytes(400, 300, ScottPlot.ImageFormat.Png);
using (MemoryStream imageStream = new MemoryStream(imageBytes))
{
return ConvertToITextImageClass.ConvertBytesToITextImage(imageBytes);
}
}
}
}
Now right-click on Reports Folder and add the following class
using iText.IO.Font.Constants;
using iText.Kernel.Colors;
using iText.Kernel.Events;
using iText.Kernel.Font;
using iText.Kernel.Geom;
using iText.Kernel.Pdf;
using iText.Kernel.Pdf.Canvas;
using iText.Layout;
using iText.Layout.Element;
using iText.Layout.Properties;
using IText7PdfPOC.Graphs;
using IText7PdfPOC.Helpers;
namespace IText7PdfPOC.Reports
{
public static class GenerateReport
{
public static MemoryStream GenerateSamplePDF()
{
try
{
var pdfPath = System.IO.Path.Combine(Directory.GetCurrentDirectory(), “PDFReports”, “sample.pdf”);
//if file exists delete it
if (File.Exists(pdfPath))
File.Delete(pdfPath);
var memoryStream = new MemoryStream();
using var Writer = new PdfWriter(memoryStream);
using var pdfDoc = new PdfDocument(Writer);
//Set Page Size A4
pdfDoc.SetDefaultPageSize(PageSize.A4);
var document = new Document(pdfDoc);
//Set Margin for the document
document.SetMargins(40, 40, 40, 40);
// Register header event handlers
pdfDoc.AddEventHandler(PdfDocumentEvent.START_PAGE, new HeaderEventHandler(document));
var BarcodQrcodTable =new Table(2, true);
var barcodeImg = GenerateBarCode.GetBarcodeImage(“1234567890”, iText.Kernel.Colors.ColorConstants.BLACK, iText.Kernel.Colors.ColorConstants.RED, pdfDoc)
.SetHeight(50)
.SetMarginTop(15f);
BarcodQrcodTable.AddCell(new Cell().Add(barcodeImg).SetBorder(iText.Layout.Borders.Border.NO_BORDER));
var qrCodeImg = GenerateQRCode.GetQRCodeImage(“https://www.google.com”, iText.Kernel.Colors.ColorConstants.BLACK, pdfDoc)
.SetHorizontalAlignment(iText.Layout.Properties.HorizontalAlignment.RIGHT)
.SetHeight(100);
BarcodQrcodTable.AddCell(new Cell().Add(qrCodeImg).SetBorder(iText.Layout.Borders.Border.NO_BORDER));
document.Add(BarcodQrcodTable);
//Add solid Line
LineSeparator ls = new LineSeparator(new iText.Kernel.Pdf.Canvas.Draw.SolidLine())
.SetStrokeWidth(5.6f)
.SetStrokeColor(DeviceRgb.RED);
document.Add(ls);
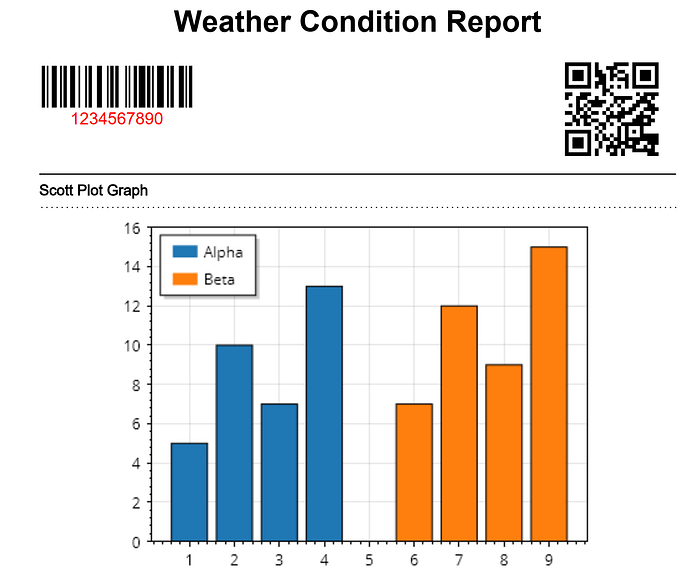
document.Add(new Paragraph(“Scott Plot Graph”).SetBold().SetHorizontalAlignment(HorizontalAlignment.CENTER));
LineSeparator ls_dotted = new LineSeparator(new iText.Kernel.Pdf.Canvas.Draw.DottedLine())
.SetStrokeWidth(5.6f)
.SetStrokeColor(DeviceRgb.RED);
document.Add(ls_dotted);
var scottGraphImg = scottplotGraphs.GenerateScottPlotBars().SetHorizontalAlignment(HorizontalAlignment.CENTER);
document.Add(scottGraphImg);
var GenerateScottPlotImg = scottplotGraphs.GenerateScottPlotBox().SetHorizontalAlignment(HorizontalAlignment.CENTER);
document.Add(GenerateScottPlotImg);
document.Add(scottplotGraphs.GenerateScottPlotGroupBox());
document.Add(scottplotGraphs.GenerateScottPlotPieSliceLabels());
//Add Page Break
document.Add(new AreaBreak(AreaBreakType.NEXT_PAGE));
document.Add(new Paragraph(“OxyPlot Charts”).SetHorizontalAlignment(HorizontalAlignment.CENTER).SetBold());
LineSeparator ls_dashed = new LineSeparator(new iText.Kernel.Pdf.Canvas.Draw.DashedLine())
.SetStrokeWidth(5.6f)
.SetStrokeColor(DeviceRgb.RED);
document.Add(ls_dashed);
document.Add(OxyPlotGraphs.GenerateOxyPlotLineChart());
document.Add(OxyPlotGraphs.GenerateOxyPlotAreaChart());
document.Add(OxyPlotGraphs.GenerateOxyPlotPieChart());
// Sample weather data
List<WeatherData> weatherData = new List<WeatherData>
{
new WeatherData(DateTime.Now.AddDays(-5), 25, “Sunny”),
new WeatherData(DateTime.Now.AddDays(-4), 28, “Hot”),
new WeatherData(DateTime.Now.AddDays(-3), 2, “Cloudy”),
new WeatherData(DateTime.Now.AddDays(-1), -2, “Cool”),
new WeatherData(DateTime.Now, 26, “Warm”),
};
document.Add(OxyPlotGraphs.GenerateOxyPlotWeatherAreaChart(weatherData));
//Add Page Break
document.Add(new AreaBreak(AreaBreakType.NEXT_PAGE));
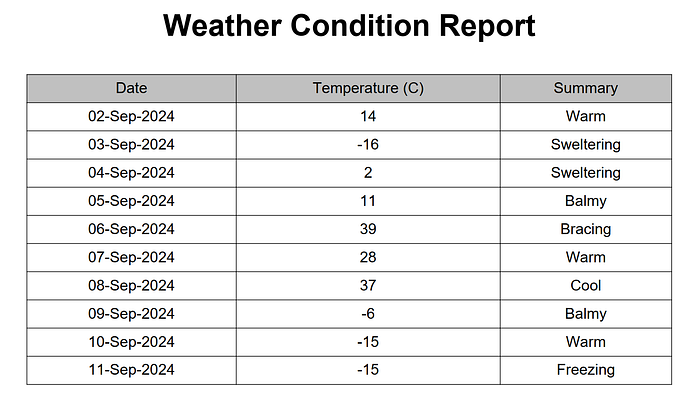
// Add a table to the document
Table table = new Table(3, false);
table.SetMarginTop(20);
table.SetWidth(UnitValue.CreatePercentValue(100));
// Add headers to the table
var dateHeaderCell = new Cell().Add(new Paragraph(“Date”)).SetFontColor(ColorConstants.BLACK).SetBackgroundColor(ColorConstants.LIGHT_GRAY);
table.AddHeaderCell(dateHeaderCell);
var tempratureHeaderCell = new Cell().Add(new Paragraph(“Temperature (C)”)).SetFontColor(ColorConstants.BLACK).SetBackgroundColor(ColorConstants.LIGHT_GRAY).SetTextAlignment(TextAlignment.CENTER);
table.AddHeaderCell(tempratureHeaderCell);
var summaryHeaderCell = new Cell().Add(new Paragraph(“Summary”)).SetFontColor(ColorConstants.BLACK).SetBackgroundColor(ColorConstants.LIGHT_GRAY);
table.AddHeaderCell(summaryHeaderCell);
string[] Summaries = { “Freezing”, “Bracing”, “Chilly”, “Cool”, “Mild”, “Warm”, “Balmy”, “Hot”, “Sweltering”, “Scorching” };
// Add data to the table
Random rng = new Random();
for (int i = 0; i < 10; i++)
{
var date = DateTime.Now.AddDays(i);
int temperature = rng.Next(-20, 40);
string summary = Summaries[rng.Next(Summaries.Length)];
table.AddCell(date.ToShortDateString());
table.AddCell(temperature.ToString()).SetTextAlignment(TextAlignment.CENTER);
table.AddCell(summary);
}
// Add the table to the document
document.Add(table);
document.Close();
// Set up a new PDF reader to update the document with total page count
var reader = new PdfReader(new MemoryStream(memoryStream.ToArray()));
var writerWithPageCount = new PdfWriter(pdfPath);
var pdfDocWithPageCount = new PdfDocument(reader, writerWithPageCount);
// Register footer event handler
pdfDocWithPageCount.AddEventHandler(PdfDocumentEvent.END_PAGE, new FooterEventHandlerWithTotalPageCount(pdfDocWithPageCount));
pdfDocWithPageCount.Close();
return new MemoryStream(File.ReadAllBytes(pdfPath));
}
catch (IOException ex)
{
throw ex;
}
}
public class HeaderEventHandler : IEventHandler
{
private Document document;
public HeaderEventHandler(Document document)
{
this.document = document;
}
public void HandleEvent(Event @event)
{
PdfDocumentEvent docEvent = (PdfDocumentEvent)@event;
PdfPage page = docEvent.GetPage();
PdfDocument pdfDoc = docEvent.GetDocument();
//get event type
var eventype = docEvent.GetEventType();
iText.Kernel.Geom.Rectangle pageSize = page.GetPageSize();
// Create a PdfCanvas to draw on the PDF page
PdfCanvas pdfCanvas = new PdfCanvas(page.NewContentStreamBefore(), page.GetResources(), pdfDoc);
// Create a Canvas object using the correct constructor
Canvas canvas = new Canvas(pdfCanvas, pageSize);
// Add a title to the document
if (eventype == “StartPdfPage”)
{
canvas.Add(new Paragraph(“Weather Condition Report”)
.SetTextAlignment(iText.Layout.Properties.TextAlignment.CENTER)
.SetFont(PdfFontFactory.CreateFont(StandardFonts.HELVETICA_BOLD))
.SetFontSize(24)
.SetMarginBottom(10)
);
//LineSeparator ls = new LineSeparator(new SolidLine());
//canvas.Add(ls)
// .SetStrokeWidth(5.6f)
// .SetStrokeColor(DeviceRgb.RED);
}
canvas.Close();
}
}
//Footer Event Handler
public class FooterEventHandler : IEventHandler
{
private readonly Document document;
public FooterEventHandler(Document document)
{
this.document = document;
}
public void HandleEvent(Event @event)
{
PdfDocumentEvent docEvent = (PdfDocumentEvent)@event;
PdfPage page = docEvent.GetPage();
PdfDocument pdfDoc = docEvent.GetDocument();
Rectangle pageSize = page.GetPageSize();
PdfCanvas pdfCanvas = new PdfCanvas(page.NewContentStreamBefore(), page.GetResources(), pdfDoc);
Canvas canvas = new Canvas(pdfCanvas, pageSize);
// Add the footer content (page number)
canvas.ShowTextAligned(
“Page “ + pdfDoc.GetPageNumber(page) + ” of “ + pdfDoc.GetNumberOfPages(),
pageSize.GetWidth() / 2,
pageSize.GetBottom() + 20,
TextAlignment.CENTER);
canvas.Close();
}
}
public class FooterEventHandlerWithTotalPageCount : IEventHandler
{
private readonly PdfDocument pdfDoc;
public FooterEventHandlerWithTotalPageCount(PdfDocument pdfDoc)
{
this.pdfDoc = pdfDoc;
}
public void HandleEvent(Event @event)
{
PdfDocumentEvent docEvent = (PdfDocumentEvent)@event;
PdfPage page = docEvent.GetPage();
Rectangle pageSize = page.GetPageSize();
PdfCanvas pdfCanvas = new PdfCanvas(page.NewContentStreamBefore(), page.GetResources(), pdfDoc);
Canvas canvas = new Canvas(pdfCanvas, pageSize);
// Add the footer content (page number)
canvas.ShowTextAligned(
“Page “ + pdfDoc.GetPageNumber(page) + ” of “ + pdfDoc.GetNumberOfPages(),
pageSize.GetWidth() / 2,
pageSize.GetBottom() + 20,
TextAlignment.CENTER);
canvas.Close();
}
}
}
}
Now go to program.cs and add the following code.
using iText.Layout;
using IText7PdfPOC.Reports;
//I Added Corse Policy to access it from Web View
builder.Services.AddCors(options =>
{
    options.AddDefaultPolicy(builder =>
    {
        builder.AllowAnyOrigin()
            .AllowAnyHeader()
            .AllowAnyMethod();
    });
});
app.UseCors();
app.MapGet("/generatePDF",(Delegate)(async (HttpContext context) =>
{
    var guid = Guid.NewGuid().ToString();
    var memoryStream= GenerateReport.GenerateSamplePDF();
    context.Response.ContentType = "application/pdf";
    context.Response.Headers.Add("Content-Disposition", $"inline; filename={guid}.pdf");
    // Write the MemoryStream to the response body
    memoryStream.Position = 0; // Reset the position to the beginning of the stream
    await memoryStream.CopyToAsync(context.Response.Body);
}));
Now See the generated PDF in the Web view. create Index.html file and give the API URL in <embed/> tag, this will request the provided URL on the Load or Reload page.
<!DOCTYPE html>
<html lang="en">
<head>
    <meta charset="UTF-8">
    <meta name="viewport" content="width=device-width, initial-scale=1.0">
    <title>Display PDF in HTML</title>
</head>
<body>
    <h1 style="text-align:center;">PDF Viewer</h1>
<!– Embeds the PDF directly into the page –>
<embed src=“https://localhost:7005/generatePDF” type=“application/pdf” width=“100%” height=“600px” />
</body>
</html>
here is the final output PDF.
Press enter or click to view image in full size
Press enter or click to view image in full size
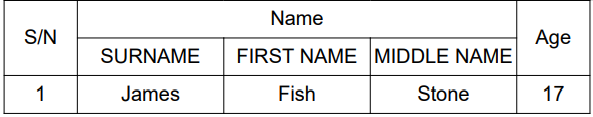
Now If you want to do Row Span or Col Span you can do it like below
Table ColSpantable = new Table(UnitValue.CreatePercentArray(new float[] { 1, 2, 2, 2, 1 }));
Cell ColSpantableCell = new Cell(2, 1).Add(new Paragraph(“S/N”))
.SetTextAlignment(TextAlignment.CENTER)
.SetVerticalAlignment(VerticalAlignment.MIDDLE);
ColSpantable.AddCell(ColSpantableCell);
ColSpantableCell = new Cell(1, 3).Add(new Paragraph(“Name”)).SetTextAlignment(TextAlignment.CENTER);
ColSpantable.AddCell(ColSpantableCell);
ColSpantableCell = new Cell(2, 1).Add(new Paragraph(“Age”))
.SetTextAlignment(TextAlignment.CENTER)
.SetVerticalAlignment(VerticalAlignment.MIDDLE);
ColSpantable.AddCell(ColSpantableCell);
ColSpantable.AddCell(“SURNAME”);
ColSpantable.AddCell(“FIRST NAME”);
ColSpantable.AddCell(“MIDDLE NAME”);
ColSpantable.AddCell(“1”).SetTextAlignment(TextAlignment.CENTER)
.SetVerticalAlignment(VerticalAlignment.MIDDLE);
ColSpantable.AddCell(“James”);
ColSpantable.AddCell(“Fish”);
ColSpantable.AddCell(“Stone”);
ColSpantable.AddCell(“17”);
document.Add(ColSpantable);
The output will be like below
If you want to Landscape your document without rotating the text you can use this line of code.
using var pdfDoc = new PdfDocument(Writer);
pdfDoc.SetDefaultPageSize(PageSize.A4.Rotate());//Page to Landscape
If you want to learn more about spanning in Itext7 please visit link!
Happy Coding!
I hope you find this article helpful. You can download the source code from my GitHub